Spherical tiling
Usually, the problem of dividing the sphere into tiles (tessellation) is solved seeking to obtain as much as possible a regular structure on the sphere. If there are few tiles, then a spherical polyhedra can be used. 20 is the maximum number of spherical divisions which can be achieved by a spherical icosahedron. And hosohedra is more often far from the desired.
There are derived methods.
1. Further fission of divisions can produce tessellation with a large number of tiles.
2. Using of semiregular polyhedra.
But the tessellation obtained by such methods is not always convenient in practice. It can completely consist of triangles, or it can consist of dissimilar elements. Imagine a strategic game with a tile map made up of triangles!
Now let’s take a look at this from the other side. What if the tiles must match some defined structure on the sphere?
We are dealing with whole planets and we want some tiles to be parts of the ocean and others to be parts of the continents. Usually, when creating tile maps, tiles are divided into the ocean and land ones, according to some principle, thereby determining the map content. And the resulting map has a resolution defining by the the number of tiles in the world map.
But, what if the division into the ocean and continents is already defined on the planet surface, and with a resolution far exceeding possible tile resolution? There may come in handy irregular tiles. Despite the name, irregular tiles may have imposed requirements. For example, there may be a convexity of tiles or an uniformity of size within certain limits.
On the plane such tessellation is, usually, made by using a Voronoi diagram. Here, we will see how to generalize this method to the surface of the sphere. And how the generated Voronoi polygons can be used to make ocean and land sectors.
We use the term ‘sector’ instead of ’tile’, since tiles are generally acting as elementary objects. But inside our sectors there are always an internal structure (terrain and geographic objects). Sectors can also act as elementary objects, serving as a tile map on sphere. For this purpose, a graph of possible transitions between sectors is also build.
SQL script constructing planet surface sectors. See also the tutorial on its use.
Polygons on planet sphere
Here, I give a description of how to partition the planet sphere into polygons using the arsenal of PostGIS tools. The only imposed requirements for polygons: convexity and uniformity of their spherical area with possible deviations of the order of the predetermined average area. Thus obtained polygons will be used to create sectors in the ocean and in the continents.
In the case of a flat map, one could break it into a Voronoi diagram of convex polygons, and could further use Lloyd’s algorithm to bring the diagram to ultimate form (Centroidal Voronoi tessellation). The essence of Lloyd’s algorithm is to repeat the creation of the Voronoi diagram, where at each iteration the centers of polygons obtained in the last iteration are taken as reference points for the new iteration.
In PostGIS there is a function ST_VoronoiPolygons, which builds the Voronoi diagram in a square area. Let’s see how we can use it for our purposes.
What will happen if we will try to use a straightforward approach? Any rectangular projection of the planet can be converted to a square by the coordinate transformation, then diagram is build, and then we can apply reverse coordinate transformation. But, the rectangles constructed will be stretched in one direction, which would be undesirable. And, if we will try to directly use Lloyd’s algorithm, polygons close to the poles of the sphere will have substantially smaller spherical area than those close to the equator.
Therefore, I offer another adapted method, which has not these flaws.
The random reference points for Voronoi diagram are chosen uniformly distributed on the sphere. In a Mercator projection, this means that they should appear less frequently towards the poles with probability proportional to the Cosine of the latitude. We construct the Voronoi diagram in the ‘world’ polygon, which is the entire planet projection or part of the projection of the planet. The ST_VoronoiPolygons function itself completes the rectangle to a square, we just need to subtract added space from the resulting diagram polygons.
The sample of the Voronoi diagram obtained by the proposed method is on the picture. Here is a part of the test planet map from the equator at the top to 73 degrees of south latitude at the bottom edge. And the lands are already subtracted from the Voronoi polygons.
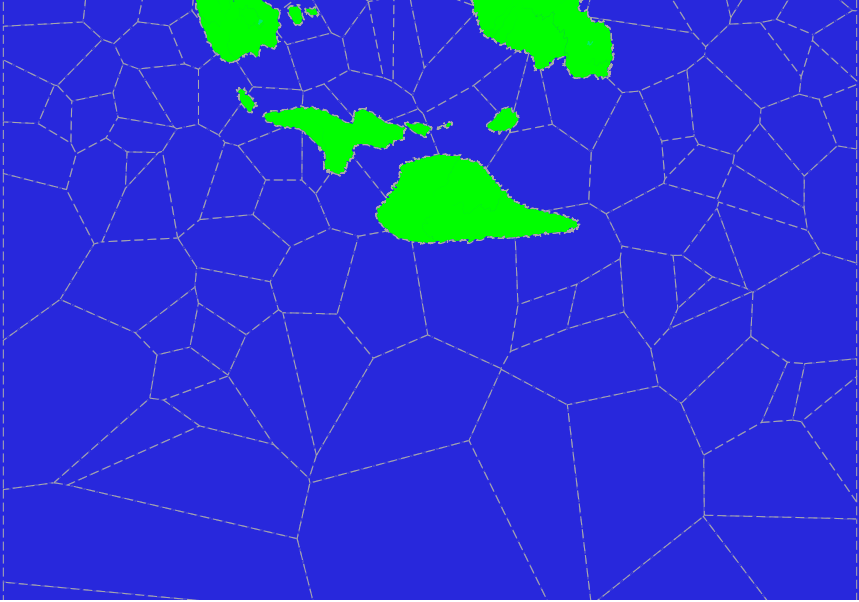
Apparently, in the Mercator projection, the polygons are usually have larger area when approaching the poles, but as spherical polygons they have the same distribution anywhere, this is what we wanted. But at the same time, the polygons have a very large dispersion in area and, because of this, the overall picture is unattractive.
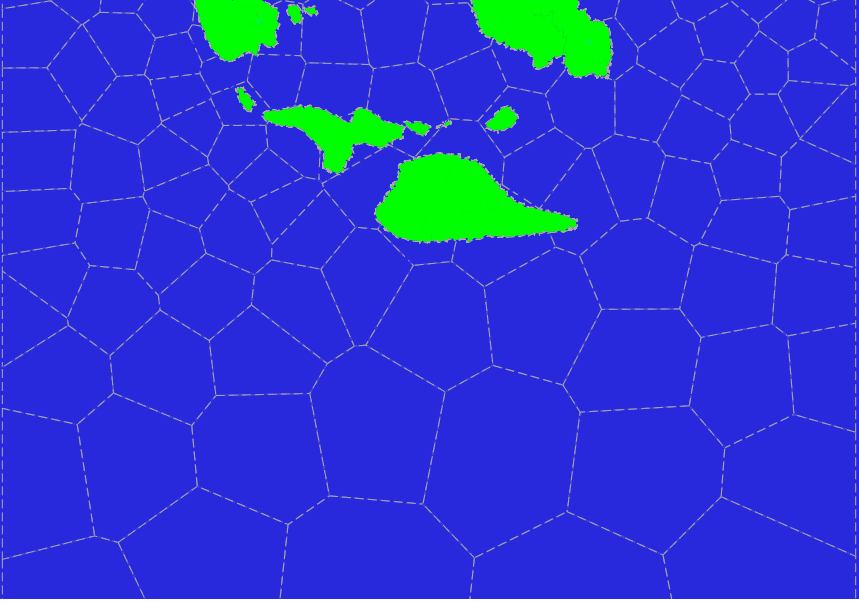
Let’s try to apply the partial Lloyd’s algorithm. As new reference points for the subsequent iterations we select the centers of the polygons obtained by clipping with ‘world’ polygon. And, to prevent too much area reduction of polygons near the poles, we do only a small number of iterations (3 or so).
After applying such a modified algorithm, we obtain the following picture, which can already be acceptable.
In the next post we will see how to make ocean sectors and, more interestingly, land sectors.