6. The biomes are also created based on the global and local lattices. At the moment, three methods of biomes placement on the planet’s surface have been implemented, but they are all based on the use of pre-created non-overlapping zones on the continents. Zones can be of different sizes, which are determined by the planet’s configuration.
The first method uses boundary curves, which are closed fractal curves encircling the planet. Those zones that fall between the boundary curves of a biome are assigned to that biome. This method can result in a large variation in the location of biomes and mixing them up.
The second method (belts) is simpler; it involves a proportional division of zones between biomes. This gives more predictable behavior of biomes depending on the latitude.
The third method (regions) simply divides zones between biomes in a random order without reference to the latitude.
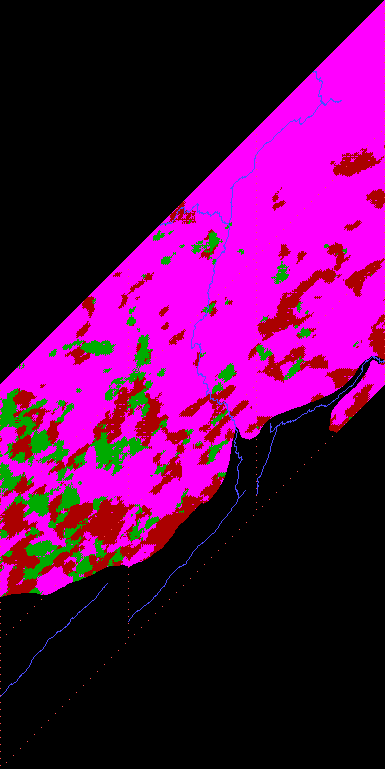
An example of rombs with biomes.
In addition, biomes have two possible behaviors concerning elevation when moving along the longitude.
The first (natural) behavior is similar to what happens with Earth biomes: they change in the same sequence both when moving towards the poles, and when moving upward. The vertical boundaries of all biomes gradually descend towards the poles. There can be several different sequences defined, but when moving along the longitude they can alternate.
The second (plain) behavior simply applies a given sequence of biomes when moving up, without taking the latitude into account.
Thus, there are six possible ways to arrange biomes depending on the latitude and elevation. Of course, not all combinations are similar to the natural (Earth) arrangement of biomes.
7. The resulting local mesh also serves as the input data for HGTS data (DEM), that is, it is converted into a satellite image data format. HGTS data is then transformed into Geotiff files to be used to generate final maps.
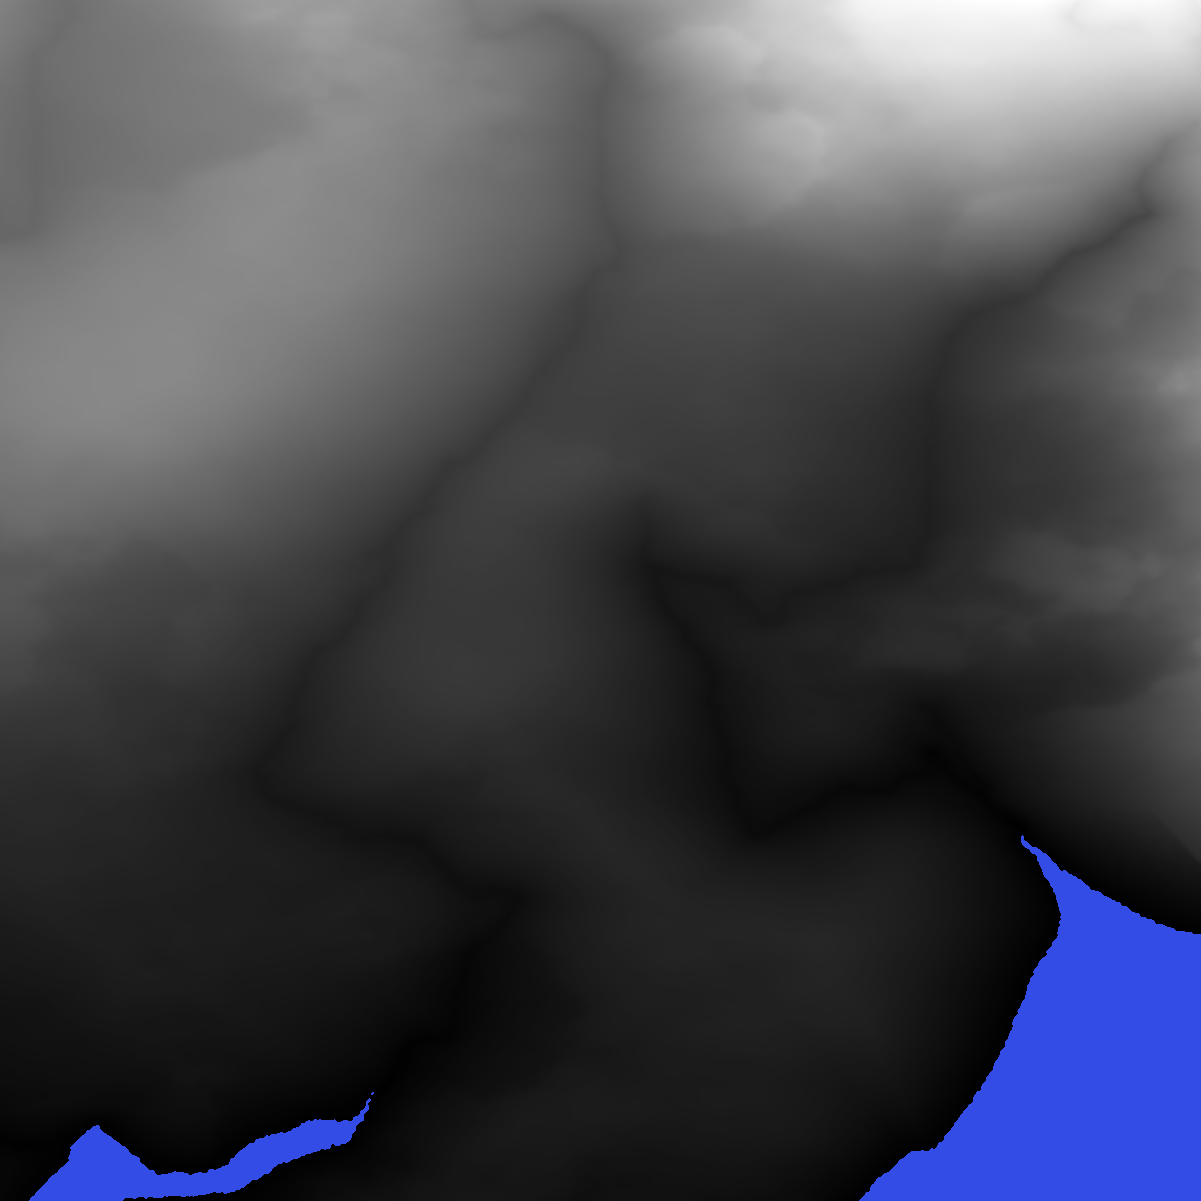
Visualization of a DEM file.
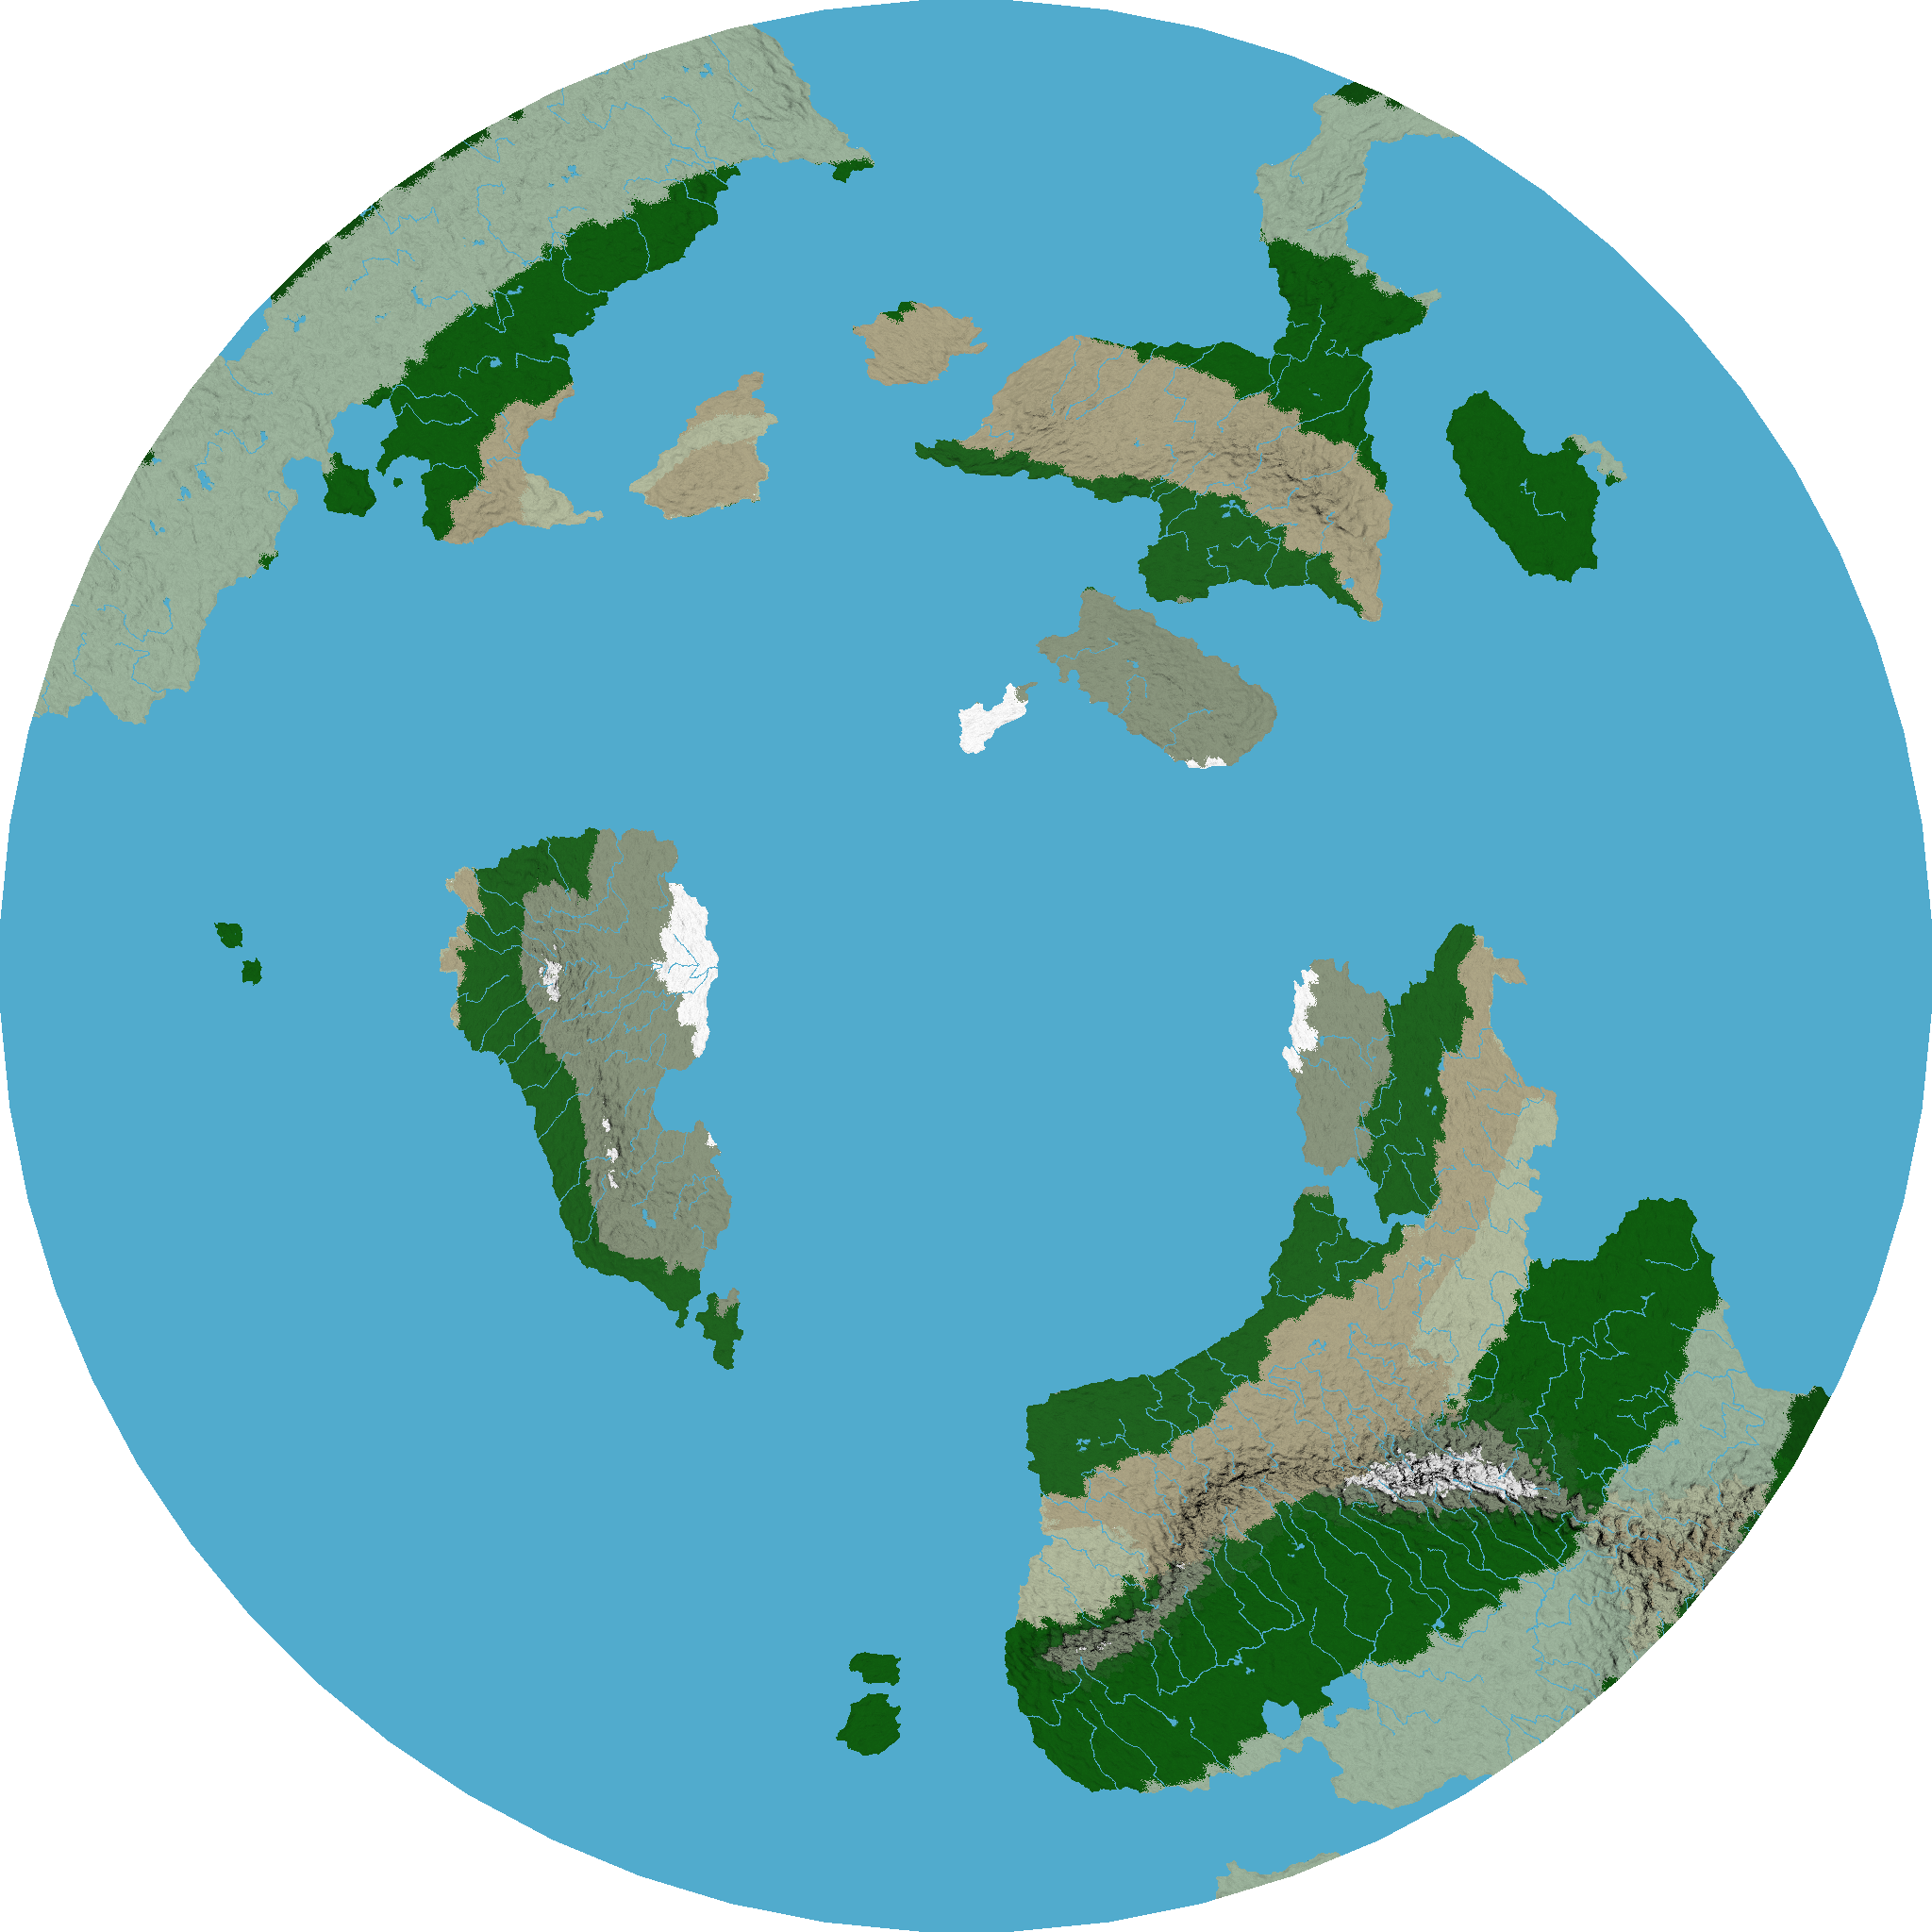
8. Creating maps. The map is an image obtained using Geotiff files, as well as various geometry objects (polygons, lines, and points). Since the data are presented in formats a modern GIS understand, you can use all that GIS power. For example, it is possible to obtain maps in different projections, or it is possible to make derived constructions, such as dividing continents into random countries, and oceans into regions.
An example of a map projection with a view to one of the poles.