Here we will learn how to use GeoJSONPlanet tool to create planet models. At the moment, GeoJSONPlanet is a small library, not pretending to be universal or to have good performance. But it can handle not very large data; you can see those planet models on this site (clicking on a small rotating model on the main page will open a big planet model).
The purposes of GeoJSONPlanet library:
- the placement of an equirectangular projection map on the sphere as a texture,
- the correct coordinate placement of vector geographic features specified by GeoJSON data on the planet sphere,
- the ability to rotate the sphere around some axis.
GeoJSON
GeoJSON is a JSON-based format for representing vector geospatial data. GeoJSONPlanet was created taking into account GeoJSON’s latest specification and accepts all currently supported geometry types, including GeometryCollection.
At the moment, there are no restrictions on the size of an input GeoJSON structure, but you should take into account the expected performance of the resulting planet model.
Most GeoJSON files contain a lot of redundant information for a small-scale planet model. This applies both to files with information about the geographical objects of the Earth, and to data files from this site, despite the fact that so far the resolution of planets is small.
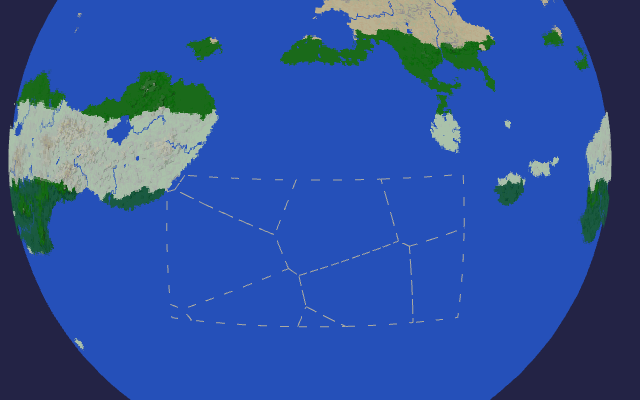
Further we will look at an example with the oceanic sectors of the Serpento planet. You can see their representation on a large model of this planet (or a planet that will replace it on the main page; although, in this case, the specific view of the sectors will be changed). As well as in the most previous tutorials, we will get by only with utilities from GDAL library.
Firstly, we have to discard redundant information and generate a smaller shapefile.
ogr2ogr -progress -overwrite -f "ESRI Shapefile" \
    -t_srs EPSG:3857 -s_srs EPSG:3857 -simplify 4000 \
    $(TMP)/OSectors0.shp shapes/ocean_sectors.shp
'$(TMP)' is the environment variable for a temporary directory. 'EPSG:3857' and 'EPSG:3857' are target and source projections (see previous tutorials). '-simplify 4000' is the option for geometry simplification by making it having only more distant nodes. Here we specify 4000m to be the preferable distance between nodes; thus, by reducing the number of nodes in a geometry, we reduce the amount of its data.
But we have to act in the other direction too, namely, we should add nodes to a geometry if the distances between existing nodes are too large. This is necessary for the correct display of arcs on the planet sphere, since each arc on the sphere is represented by a polygonal line of small segments.
ogr2ogr -progress -overwrite -f "ESRI Shapefile" \
    -t_srs EPSG:3857 -s_srs EPSG:3857 -segmentize 110000 \
    $(TMP)/OSectors1.shp $(TMP)/OSectors0.shp
Execution of 'ogr2ogr' utility with the option '-segmentize 110000' makes additional nodes in the geometries so that the minimum distance between them becomes 110km, which is about half of the longitude degree at the equator.
Note, that using both options '-simplify' and '-segmentize' at the same time leads to strange results.
To get the final GeoJSON file we must translate data from ESRI Shapefile format to GeoJSON file format.
ogr2ogr -progress -f GeoJSON -t_srs wgs84 -s_srs EPSG:3857 \
        -lco COORDINATE_PRECISION=2 ./osectors.json $(TMP)/OSectors1.shp
The option '-lco COORDINATE_PRECISION=2' forces all coordinate values in the resulting file to be with the specified number of symbols after the point. This option can be critical, if you need to minimize the file loading time.
Thus, we now have a smaller GeoJSON file 'osectors.json', made without losing significant information for our purposes.
HTML
GeoJSONPlanet is based on ThreeJS JavaScript library, including OrbitControls and BufferGeometryUtils modules from its distribution. Therefore, our HTML have to include the following lines.
<script src="./threejs/build/three.min.js"></script>
<script src="./threejs/examples/js/utils/BufferGeometryUtils.js"></script>
<script src="./threejs/examples/js/controls/OrbitControls.js"></script>
<script src="./js/geoJSONPlanet.js"></script>
Here we consider that unpacked distribution of ThreeJS library is in 'threejs' directory, and 'geoJSONPlanet.js' file is in 'js' directory.
To load a GeoJSON file, we will use the following function
function loadJSON(fpath, success, error) {
    var xhr = new XMLHttpRequest();
    xhr.onreadystatechange = function() {
        if (xhr.readyState === XMLHttpRequest.DONE) {
            if (xhr.status === 200) {
                if (success) success(JSON.parse(xhr.responseText));
            } else {
                if (error) error(xhr);
            }
        }
    };
    xhr.open("GET", fpath, true);
    xhr.send();
}
The next function will create the 'GeoJSONPlanet' object with the specified properties. 'drawGeoJSON' method transmits json data to the object and draws geospatial features on the planet sphere.
const start = function(json){
    GeoJSONPlanet(
        'equirectangular-b.png',
        'planet_view',
        {axisAngle: 17, oceanColor: '0x2550b9', background: '0x232345'}
    ).drawGeoJSON(json, subsFtOptsArr).rotate(0.001);
};
We pass this function to 'loadJSON' function as the parameter 'success', and it will be called when the json download is successful.
'subsFtOptsArr' is a structure determining the appearance of geographical features (style), we will see how it works later.
'loadJSON' function call looks like this
loadJSON('osectors.json',
    start,
    function(xhr) { console.error(xhr); }
);
In addition, our HTML must contain a canvas for drawing the planet model in it.
<canvas id="planet_view"></canvas>
CSS
CSS for drawing a full-page planet model can be like this
#planet_view {
    display: block;
    margin: 0px;
    width: 100%;
    height: 900px;
}
GeoJSONPlanet constructor
'GeoJSONPlanet' is JavaScript class, that can be instantiated by calling a function
GeoJSONPlanet( texture, canvasDOMId, opts ),
which returns planet model object. 'texture' is a equirectangular projection map (or other image, if you choose it), 'canvasDOMId' is id of the canvas HTML element (document element, if it is null), 'opts' is the configuration object with optional parameters.
Here are all current possible members of 'opts' object.
- width : width of canvas (default: canvas.clientWidth),
- height: height of canvas (default: canvas.clientHeights),
- background : background color (default: ‘0x000000’),
- enableZoom : enable a user to zoom camera (default: true),
- cam.fov : camera field of view (default: 42),
- cam.near : camera near limiter (default: 0.1),
- cam.far : camera far limiter (default: 2.7),
- cam.zPos : camera z position (default: 3),
- sphereWidthSegs : SphereGeometry widthSegments parameter (default: 80),
- sphereHeightSegs : SphereGeometry heightSegments parameter (default: 60),
- oceanColor : color of the ocean sphere (default: ‘0xaaaaaa’),
- textureFilter : minFilter value for the planet sphere texture (default: THREE.NearestMipmapNearestFilter),
- axisColor : color of the rotation axis (default: ‘0xffffff’),
- axisAngle : angle of the rotation axis (default: 0, currently angle can be only in XY plane),
- dMin : minimum distance (grad) between nodes of various string dependent geometries; if specified then the special precedure supplements strings with additional nodes (default: null),
- dFuncN : if 'dMin' is specified the special function can provide additional nodes; that function uses method specified by 'dFuncN' option for defining distance between two points on the sphere (1: the fastest, but inaccurate; 2: more slowly, but accurate for close points; 3: exact, but the slowest; default: mixed approach),
The last two options are required only if you cannot do preliminary segmentation (and simplification) of GeoJSON data for some reason, for example, if you generate JSON structures online.
Methods
After instantiating GeoJSONPlanet object with a valid texture, you can immediately make the model spin with following method.
rotate(speed).
Default 'speed=0.001'.
Or you can let a user to rotate model arbitrary as he/she wanted.
control(speed).
Default 'speed=0.2'.
Drawing GeoJSON data is done using the method
drawGeoJSON(geojson, subsFtOptsArr).
Styles
'subsFtOptsArr' is special (json) structure for defining of drawing styles of GeoJSON features. For clarity, it is best to resort to an example
const subsFtOptsArr = [
{
  'Polygon': {"linewidth" : 1, 'color': '0x2550b9'},
  'MultiPolygon': {"linewidth" : 1, 'color': '0x2550b9'}
},
{
  'Point': {"radius" : 0.02, 'color': '0xf00000'},
  'MultiPoint': {"radius" : 0.02, 'color': '0x2f0000'},
  'LineString': {"linewidth" : 1, 'color': '0xf0f000'},
  'MultiLineString': {"linewidth" : 1, 'color': '0xf0f000'},
  'Polygon': {"linewidth" : 1, 'color': '0xaaa9a0', "dashSize": 0.02, "gapSize": 0.03},
  'MultiPolygon': {"linewidth" : 1, 'color': '0xaaa9a0', "dashSize": 0.02, "gapSize": 0.03}
}
];
So, it is an array of several objects that are objects with ThreeJS Material properties for creation the corresponding geometric objects by ThreeJS library. All unspecified options are supplemented with default values, which are currently defined as the following
const defaultFtOpts = {
  'Point': {'radius': 0.01, 'widthSegs': 8, 'heightSegs': 6, 'color': '0x000000'},
  'MultiPoint': {'radius': 0.01, 'widthSegs': 8,'heightSegs': 6, 'color': '0x000000'},
  'LineString': {'linewidth': 1, 'color': '0x000000'},
  'MultiLineString': {'linewidth': 1, 'color': '0x000000'},
  'Polygon': {'linewidth': 1, 'color': '0x000000'},
  'MultiPolygon': {'linewidth': 1, 'color': '0x000000'}
};
The number of elements in 'subsFtOptsArr' array shows how many times the GeoJSON feature will be drawn on the model with the specified Material properties. This allows us to draw the polygon boundaries with a dashed line, while avoiding overlapping patterns of two dashed lines (for example, if two polygons have a common border).
But this approach of assignment a drawing style to features has such a disadvantage that all features of the GeoJSON structure will be drawn as many times as there are elements in the 'subsFtOptsArr' array. Therefore, an alternative approach is provided when the style of a feature is specified in the GeoJSON structure itself for each feature separately.
For this we use 'properties' member of the feature object in which we look for 'threeJSOpts' member, which in turn should be an array of valid Material properties for this feature type.
{
    "type": "FeatureCollection",
    "features": [{
        "type": "Feature",
        "geometry": {
            "type": "Point",
            "coordinates": [112.0, 30.5]
        },
        "properties": {
            "threeJSOpts": [{
                "color": "0x44aa00",
                "radius" : 0.01
            }]
        }
    }, {
        "type": "Feature",
        "geometry": {
            "type": "LineString",
            "coordinates": [
                [100.0,10.0],
                [105.0,27.0],
                [123.0,35.0]
            ]
        },
        "properties": {
            "prop0": "value0",
            "threeJSOpts": [{
                "linewidth": 1
            }]
        }
    }]
}
Styles defined in this way are complemented by those defined in 'subsFtOptsArr' and take precedence over them.
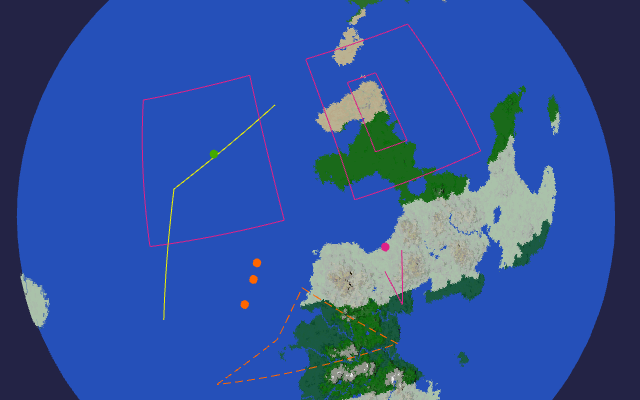
On the next picture you can see the features from some GeoJSON file, having different rendering styles.